Correlation captures a linear pattern
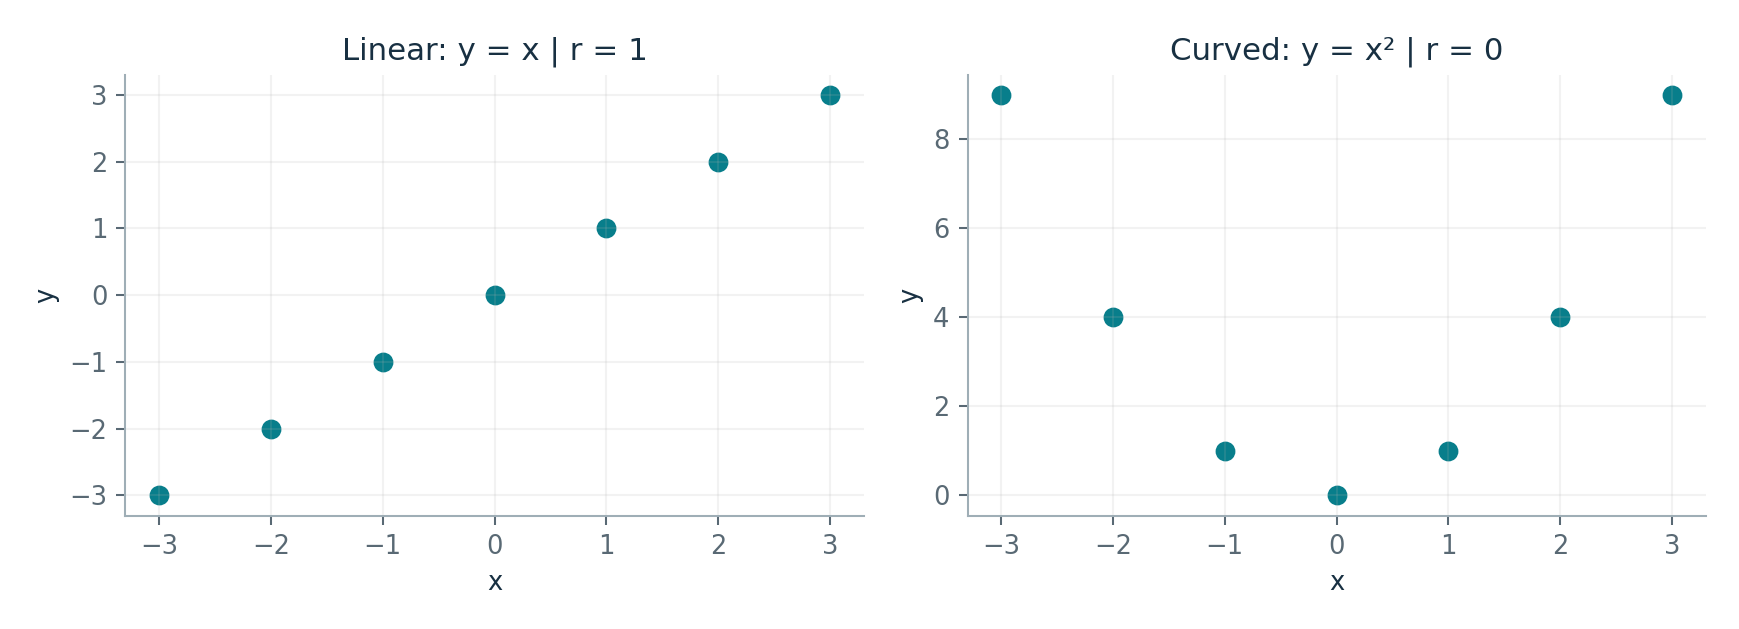
Pearson correlation measures the direction and strength of a linear relationship. A value near zero does not rule out a curved relationship.
Pearson correlation r is unitless and ranges from-1 to 1 when both variables vary. Its sign indicates linear direction and magnitude summarises linear association. It does not express the slope in original units, establish causation or capture every kind of relationship.
For symmetric x values -3,-2,-1,0,1,2,3 with y=x squared, the relationship is perfectly deterministic and U-shaped, yet linear correlation is 0. Plot before treating a zero correlation as no relationship. A constant variable makes the usual correlation denominator zero.
Source: W5 PDF pp. 3-51, 53. The lecture uses both a constructed 200-student support example and a synthetic 4,665-registration course dataset. They are different tables with different units.
Practice problems
Supplementary study questions on the lecture concepts — not verbatim exam questions. Each answer counts toward spaced review.
1. Conceptual understanding
Definitions and distinctions.
Can y=x² have Pearson r=0 over symmetric x values?
What does a correlation of 0.8 establish by itself?
2. Application
Apply the concept to a case or calculation.
A negative Pearson correlation describes what?
What are the units of Pearson r?
3. Interpretation and limitations
Evaluate assumptions and justify conclusions.
Every x value is identical. What happens to the usual Pearson correlation?
Which is the most useful next step after seeing r near zero?
Explain it in writing
Self-checked, not marked. Write a few sentences, then compare with the example answer. Your writing is saved as you type.
Show an example answer
Pearson r summarises linear association. A curved rule such as y=x² can determine y even when the positive and negative parts cancel in the linear summary.
Check: did you answer the question, use evidence or working, and avoid claiming more than the evidence supports?
Show an example answer
A common cause, reverse direction or selection can produce an association. A causal claim needs a suitable design and assumptions about those alternatives.
Check: did you answer the question, use evidence or working, and avoid claiming more than the evidence supports?