Simpson's paradox: calculate all three views
A group can do better within every subgroup but worse overall if the groups contain different mixes of easier and harder cases.
The constructed support study is observational. Readiness is measured before support; participation is not randomly assigned.
| Readiness | Support: passes/total | No support: passes/total |
|---|---|---|
| Lower | 48/80 = 60% | 10/20 = 50% |
| Higher | 18/20 = 90% | 64/80 = 80% |
| Pooled | 66/100 = 66% | 74/100 = 74% |
Within each readiness level, support has a 10 percentage-point advantage. Overall, support has an 8 percentage-point disadvantage. There is no arithmetic contradiction: the support group contains 80% lower-readiness students, while the no-support group contains 20%.
The weighted calculations are:
- Support:0.800.60+0.200.90=0.66.
- No support:0.200.50+0.800.80=0.74.
Simply averaging 60% and 90% gives 75%, which assumes equal subgroup weights and is not the observed support-group rate. Correct pooling uses subgroup size divided by group total; weights sum to 1.
At a hypothetical common 50:50 readiness mix, support gives 0.560%+0.590%=75%, and no support gives 0.550%+0.580%=65%. These standardised rates answer a common-composition question. They are calculated scenarios, not newly observed students and not automatically causal effects.
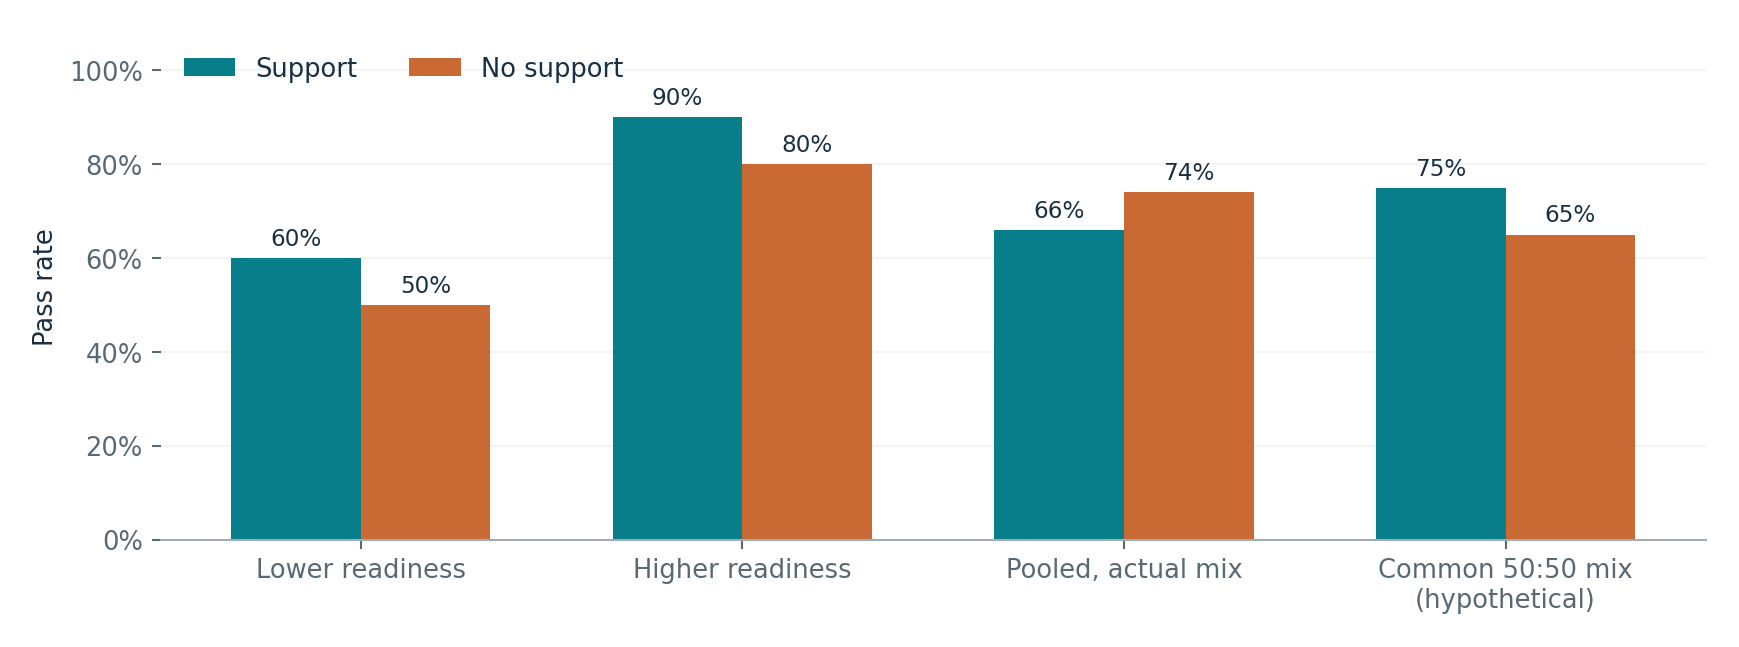
Simpson's paradox: a pooled association can have the opposite direction from associations within groups. To explain it, name the grouping variable, calculate conditional rates, show different weights, and state the claim limit. Do not merely write the label.
Source: W5 PDF pp. 3-51, 53. The lecture uses both a constructed 200-student support example and a synthetic 4,665-registration course dataset. They are different tables with different units.
Practice problems
Supplementary study questions on the lecture concepts — not verbatim exam questions. Each answer counts toward spaced review.
1. Conceptual understanding
Definitions and distinctions.
Why can a pooled comparison reverse within-group comparisons?
Support rates are 60% and 90%, with weights 80% and 20%. What is the pooled rate?
2. Application
Apply the concept to a case or calculation.
Support has 48/80 passes and no support 10/20. What are the rates?
No-support rates are 50% and 80% with weights 20% and 80%. What is pooled rate?
3. Interpretation and limitations
Evaluate assumptions and justify conclusions.
At a common 50:50 mix, support rates 60% and 90% give what result?
The common-mix support rate is higher. Does this prove support caused the improvement?
Explain it in writing
Self-checked, not marked. Write a few sentences, then compare with the example answer. Your writing is saved as you type.
Show an example answer
Support students have higher pass rates within each readiness group, but the support group contains many more lower-readiness students, whose baseline pass rates are lower, so its pooled rate is lower.
Check: did you answer the question, use evidence or working, and avoid claiming more than the evidence supports?
Show an example answer
Support gives 0.5×60%+0.5×90%=75%; no support gives 65%. These are common-mix calculations, not new observations or automatic causal effects.
Check: did you answer the question, use evidence or working, and avoid claiming more than the evidence supports?